
Snapdragon.
That's how.
You pick the where. You pick the what.
And it doesn’t matter why. We’ll bring the how.
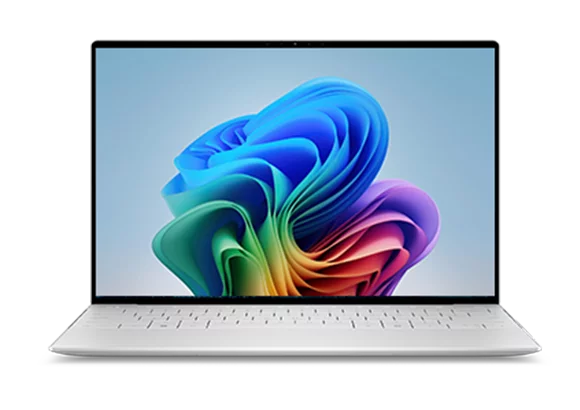
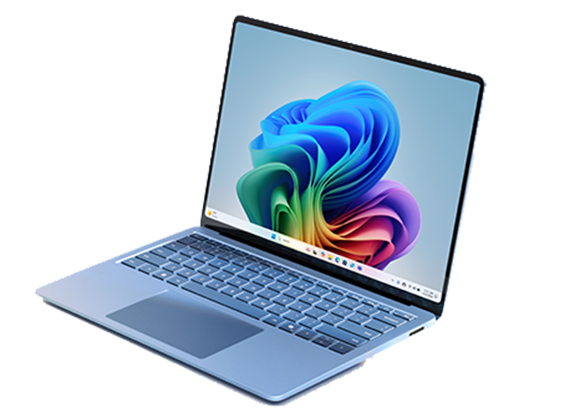
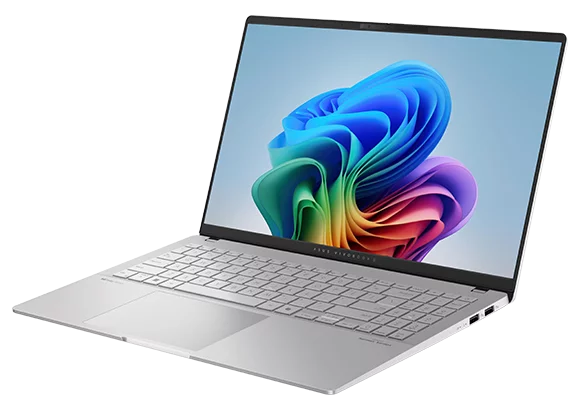
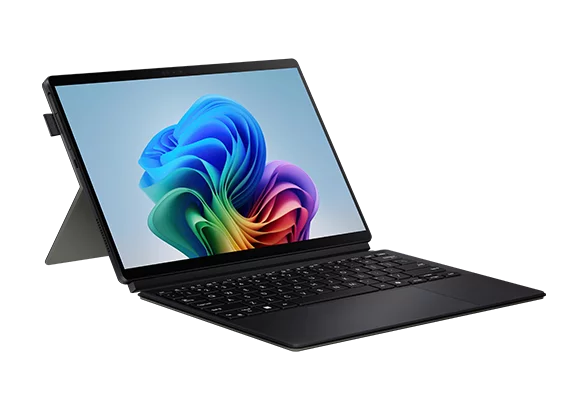
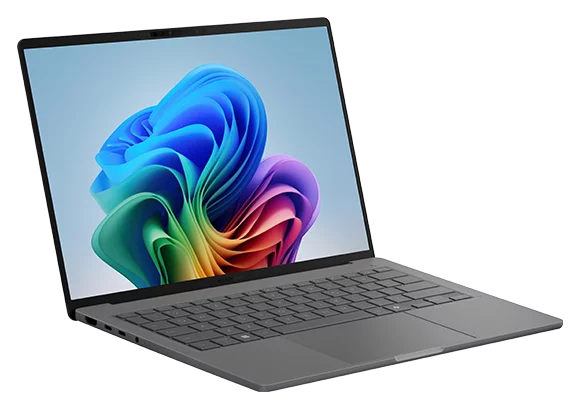
PCs powered by Snapdragon® X2 Series Processors simply do more, so you can too.
You wanted a superior laptop? Snapdragon delivers
BATTERY
How do you edit creative projects without an outlet in sight?
PERFORMANCE
How do you multitask to the max, without slowdowns?
AI
How do you get so much done with AI, even when you're offline?

Meet the processor your PC wishes it had
Apr 24, 2026 | 1:00
The most popular Windows apps, turbocharged
Universal app support on Snapdragon X2 Series platforms. Smooth, lag-free, responsive.
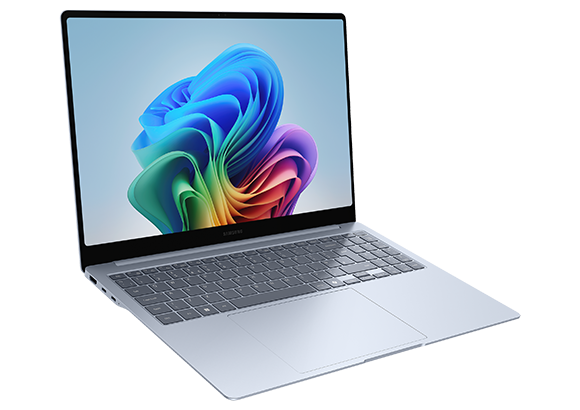
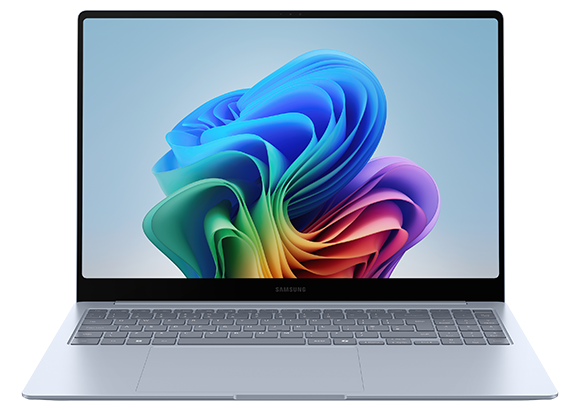
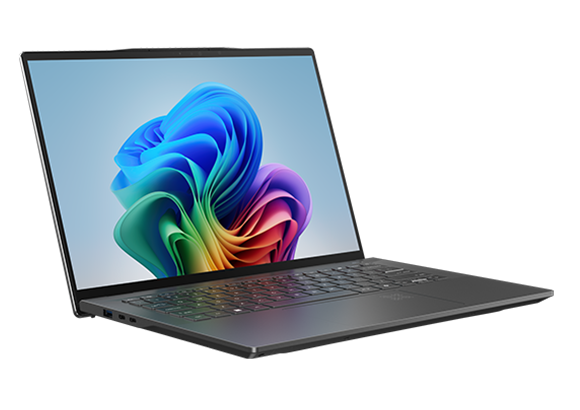
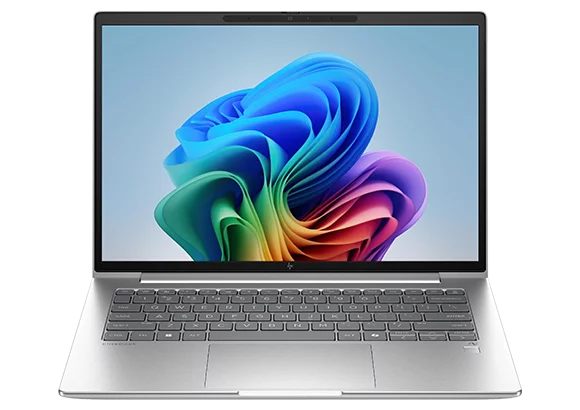
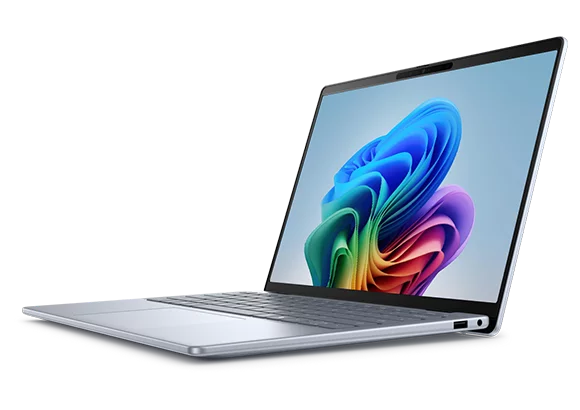
Powering the brands you trust
Visit your favorite brand to see what Snapdragon laptops are available.


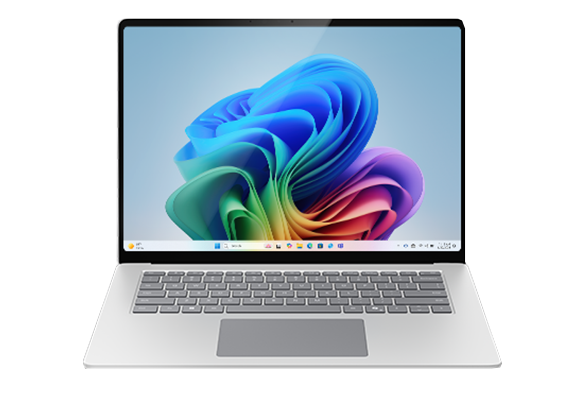
Handle your biz with Snapdragon
Work hard. Work smarter. The bottom line? Snapdragon delivers everything you need to win today—and tomorrow. Everywhere you do business.

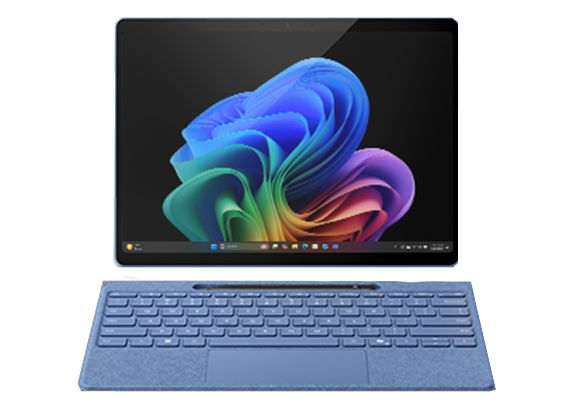
Powerful processors
for every PC person


Tech that’s a high-key flex
Work hard. Work smarter. The bottom line? Snapdragon delivers everything you need to win today—and tomorrow. Everywhere you do business.


Frequently asked questions
The Snapdragon X2 lineup offers consumers the leading processors for Windows, with performance benchmarks that stand out against both Intel Core Ultra and AMD Ryzen chips. Please visit snapdragon.com/claims for detailed information.
1Snapdragon X2 Elite Extreme CPU performance is 2x faster based on Geekbench 6.5 Multi Core score on QTI reference design in Sept 2025 than Intel Core Ultra 9 285H (ASUS Zephyrus G16), Intel Core Ultra 9 288V (Acer Swift 16 AI OLED), AMD Ryzen AI 9 HX 370 (ASUS Vivobook S14), & Apple M4 (Macbook Air 15”).
2 Battery life varies significantly based on device, settings, usage, and other factors.
3CPU Performance is based on Cinebench 2024 Multi-Core run on Windows 11 Qualcomm reference design with Snapdragon X2 Elite Extreme (X2E-96-100) in Nov 2025 and Apple M5 on 15" MacBook Pro M5 in Apr 2024. Power and performance comparison reflects results based on measurements and hardware instrumentation of given devices.
4 CPU Performance is based on Geekbench v6 Single-Core runs on the following Windows 11 devices: Qualcomm reference design with Snapdragon X2 Elite Extreme (X2E-96-100) in Nov 2025 and ASUS Zenbook
5 Snapdragon X2 Elite Extreme NPU performance is 5x faster based on Geekbench AI 1.4 score on QTI reference design in Sept 2025 than Intel Core Ultra 9 285H (ASUS Zephyrus G16), Intel Core Ultra 9 288V (Acer Swift 16 AI OLED), AMD Ryzen AI 9 HX 370 (ASUS Vivobook S14), & Apple M4 (Macbook Air 15”).
6Compared to Intel Core Ultra 9. NPU performance is based on UL Procyon AI Computer Vision score on the following Windows 11 devices: Snapdragon X2 Elite Extreme (X2E-96-100), Snapdragon X2 Elite 18-core (X2E-88-100) on Qualcomm reference designs in Nov 2025; Intel Core Ultra 9 285H on ASUS Zenbook 14 UX3405CA in Sept 2025. Power and performance comparison reflects results based on measurements and hardware instrumentation of given devices.
7CPU Performance is based on Cinebench 2024 Multi-Core run on Windows 11 Qualcomm reference design with Snapdragon X2 Elite 18-core (X2E-90-100) in Nov 2025 and Apple M5 on 15" MacBook Pro M5 in Apr 2024. Power and performance comparison reflects results based on measurements and hardware instrumentation of given devices.
8 CPU Performance is based on Cinebench 2024 Multi-Core run on Windows 11 Qualcomm reference design with Snapdragon X2 Elite 12-core (X2E-88-100) in Nov 2025 and Apple M4 on 15" MacBook Air M4 in Apr 2024. Power and performance comparison reflects results based on measurements and hardware instrumentation of given devices.
9 Performance is based on Cinebench 2024 CPU Multi Core test run between November 2024 and April 2025. Snapdragon X Elite (X1E-80-100) was tested using a Dell XPS 13 (9345) on Microsoft Windows 11 Home Build 26100. Apple M4 was tested using an Apple MacBook Air 15-inch (MC7C4HN/A) on MacOS Sequoia 15.5. Performance comparison reflects results based on measurements and hardware instrumentation of given devices.
10 CPU Performance is based on Cinebench 2024 Multi-Core run on Windows 11 Qualcomm reference design with Snapdragon X Plus (X1P-64-100) in Feb 2025 and Apple M3 15" MacBook Air M3 in April 2024. Power and performance comparison reflects results based on measurements and hardware instrumentation of given devices.
11 CPU Performance is based on Cinebench 2024 Multi Core run from April 2024 to Jan 2025 on the following Windows 11 devices: Intel Core Ultra 7 256V on Dell XPS 13 (9350) (max. performance reflected represents max. achievable results in given platform SlowLimit/ FastLimit settings and no thermal limitations); Snapdragon X Plus (X1P-46-100) on Qualcomm reference design. Power and performance comparison reflects results based on measurements and hardware instrumentation of given devices.
12 CPU Performance is based on Cinebench 2024 Multi Core run on the following Windows 11 devices: Intel Core Ultra 5 125U (12 core) on HP Pavilion 16 (AF0015TU) laptop in April 2024; Snapdragon X 8-core (X1-26-100) on Qualcomm reference design in April 2025. Power and performance comparison reflect results based on measurements and hardware instrumentation of given devices.
13 CPU Performance is based on Geekbench 6.5 Multi-Core score on Windows 11 OS, run in September 2025. Snapdragon X2 Elite Extreme (X2E-96-100) was tested using a Qualcomm reference design. Intel Core Ultra 9 285H was tested using an ASUS Zephyrus G16 (GU605CP). Intel Core Ultra 9 288V was tested using an Acer Swift 16 AI OLED (SF16-51T-98SE). AMD Ryzen AI 9 HX 370 was tested using a ASUS Vivobook S14 (M5406). Maximum performance reflected by Intel platforms represent maximum achievable results in given platforms under unconstrained PL1/PL2 settings and no thermal limitations. Maximum performance reflected by AMD platforms represent maximum achievable results in unconstrained SlowLimit/FastLimit settings and no thermal limitations. Power and performance comparison reflects results based on measurements and hardware instrumentation of given devices. Lowest power and performance figures may not represent the lowest achievable platform power and performance. Idle-normalized platform power is measured with idle periods removed.