
On this Page
Introduction
License
Community
Get the Qualcomm® newsletter straight to your inbox.
The PlotTwist dataset enables you to study visual reasoning with Vision-Language Models (VLMs) to answer human-readable questions about images of mathematical graphs.
You can test with over 2,800 high-resolution image-data pairs (benchmark data), where each pair contains:
- A graph/plot of a mathematical function.
- Data, including a question about the image and the correct answer (e.g., "which subplot has the largest number of discontinuous functions?").
The PlotTwist dataset also includes a training set of approximately 200,000 image-data pairs for re-training and fine-tuning the model.
Tasks are categorized into three levels of increasing difficulty:
- Single-function
- Multi-function
- Multi-plot (the most challenging)
To answer questions about plots in the images, a model must aggregate local and global information from multiple subplots across images.
The questions are designed to ensure that simple off-the-shelf visual tools, such as optical character recognition (OCR) systems, are insufficient to perform well on the benchmark, so you can prove that a VLM is superior to such systems.
The image below shows a sampling of plots that are part of the PlotTwist benchmark:
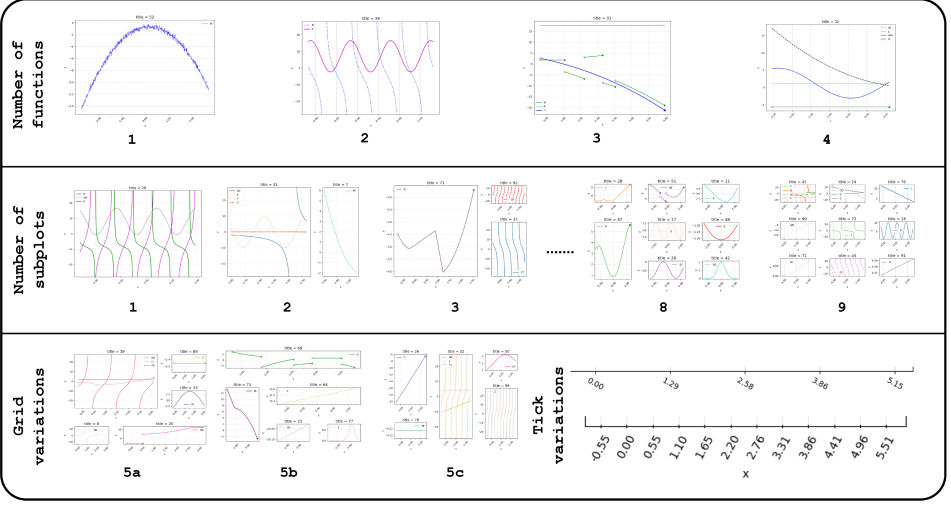
Figure 1: Sampling of plots in the PlotTwist benchmark. Top: Each (sub) plot can accommodate one to four functions. Middle: Each plot can accommodate between one and nine subplots. Bottom-left: The layout of subplots exhibits diversity. Bottom-right: Individual axes show a diverse set of features, such as size, count, rotation of ticks.
PlotTwist Categories
1. Single-function: Figure 2 consists of a single plot containing one mathematical function:
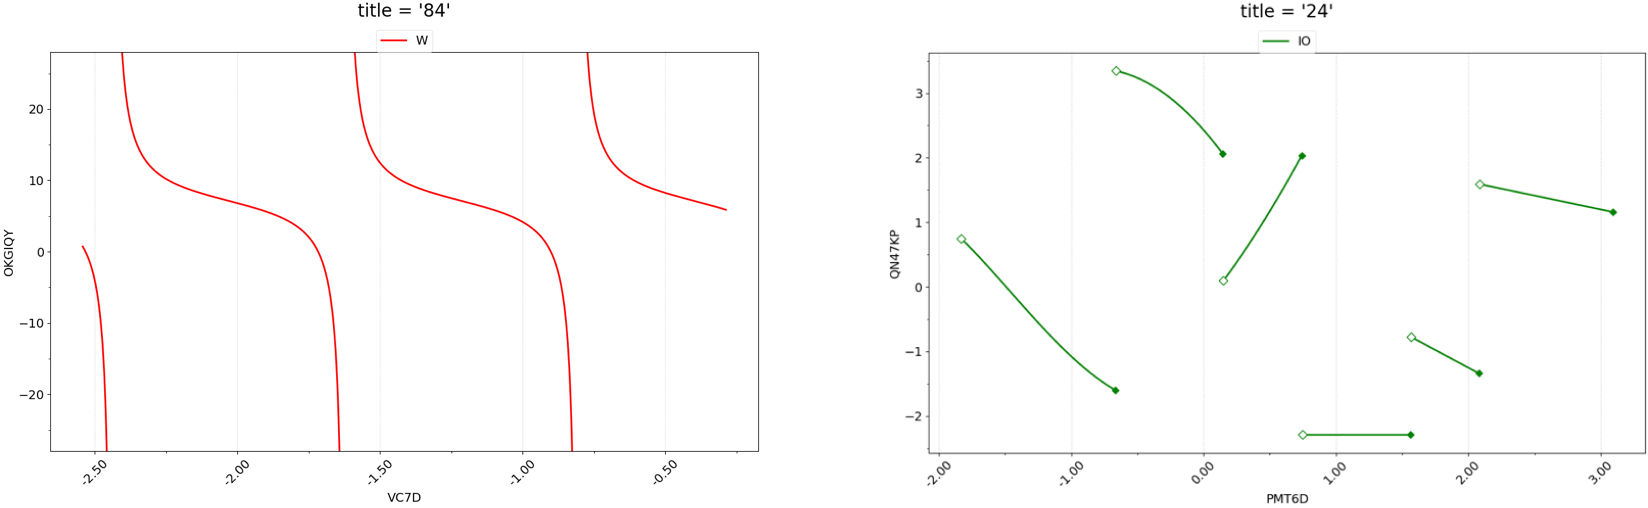
Figure 2: Single-Function Plots
2. Multi-function: Figure 3 consists of a single plot containing multiple mathematical functions:
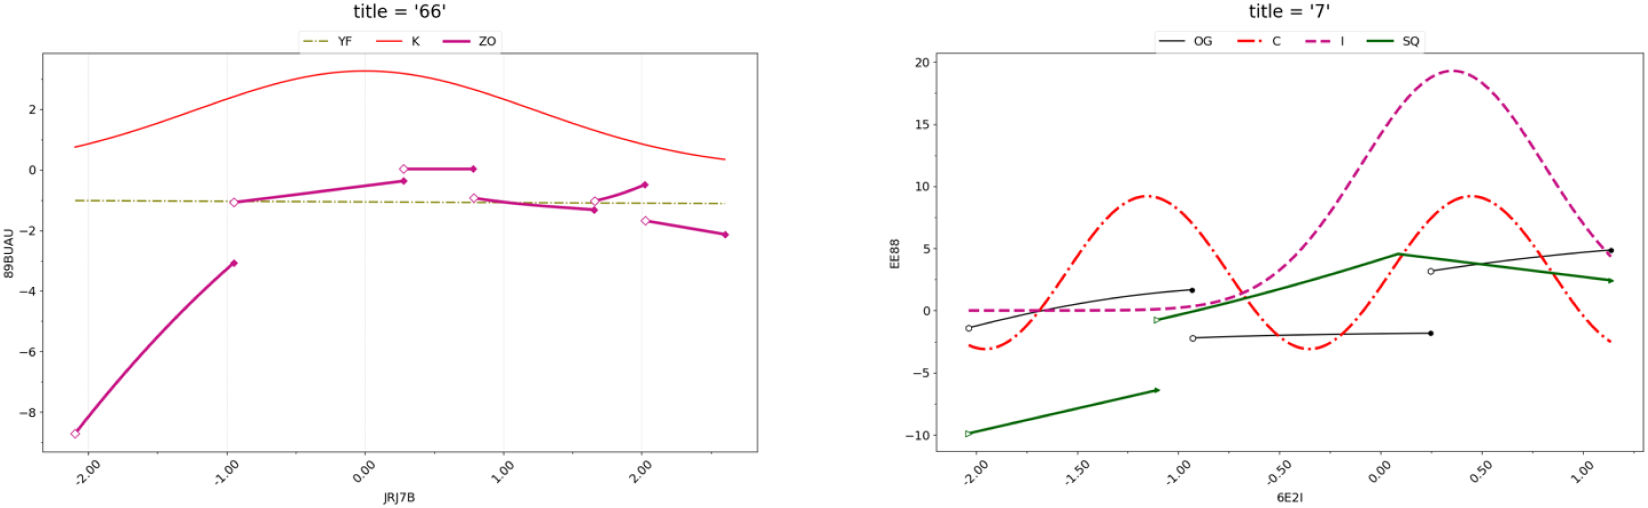
Figure 3: Multi-Function Plots
3. Multi-plot: Figure 4 consists of multiple (sub)plots, with each subplot containing a varying number of functions (one through four).
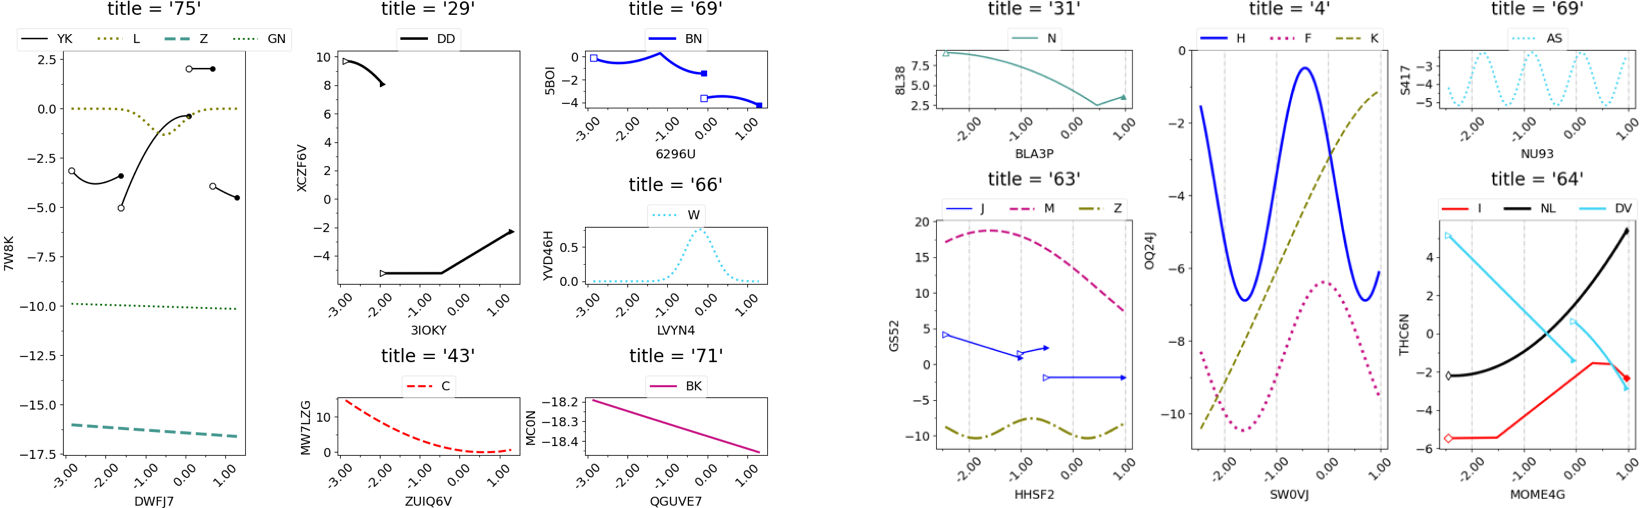
Figure 4: Multi-plots plots
Note: The categorical distribution of the 2800 benchmark pairs is shown in Figure 5, with most questions belonging to the multi-plot category:
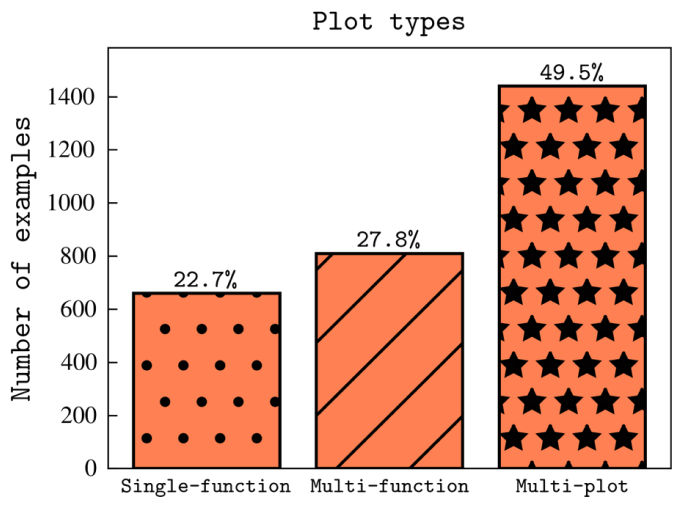
Figure 5: Distribution of single-function, multi-function, and multi-plot samples in the benchmark.
Example Usage
If you provide the labeled plots shown in Figure 6 to a VLM, along with the question "Which subplot has the largest number of discontinuous functions?", the VLM should return "45" (i.e., the plot titled "45").
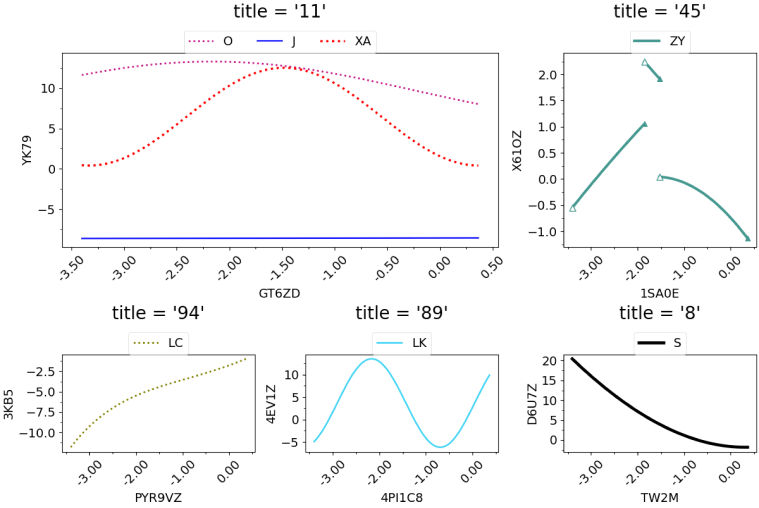
Figure 6: Example of identifying the subplot with the largest number of discontinuous functions.
Example JSON
The following example shows the JSON data that corresponds to the graphs and plots in Figure 6:
{
	"question":"Which subplot has the largest number of discontinuous functions?",
	"answer":"45 subplot has 1 discontinuous function. The answer is 45.",
	"answer_values":["45"],
	"ans_type":"strings",
	"target_step":null,
	"tags":["free"],
	"meta_data":{"max_count":1},
	"qtype":"count_discontinuous_multi-plot",
	"mode":"multi plot",
	"num_subplots":5,
	"num_funcs_on_fig": 7
}
Dataset details
Size
15.1 GB
Training Size
200,000
Test Size
2,793
Input Sample:
(Image, Question)
Image Resolution
1200 x 800 pixels
Source
Programmatically generated
Language(s)
English
PlotTwist benchmark 'PlotTwist-benchmark.zip' (411M) contains the files associated with the benchmark.
The questions for the dataset were generated using human-written templates. Images and data were generated programmatically using Matplotlib and Python.
The training data consists of three sub-directories corresponding to the three categories:
- /single_function
- /multi_function
- /multi_plot
Each of those sub-directories has the following items:
- plots/:Sub-directory containing images associated with the questions, mapped using filenames.
- qa.json:Question-answer pairs along with other relevant information (described below).
- qa_mini.json:In-distribution test set associated with the training set.
- test_ind_qa.json:In-distribution test set associated with the training set.
- test_ood_qa.json:Out-of-distribution test set associated with the training set.
Field
Description
question
Question to associate with the image.
answer
Answer to the question, in sentence form.
answer_values
Answer with only the ground-truth value.
ans_type:
Data type of the answer in answer_values. Can be:
- strings
- floats
- integers
Note: See Figure 7 below for a breakdown of datatypes in the benchmark.
target_tick:
Length of step of the target tick (x/y), for answers involving outputting a numerical value.
tags
Tags associated with the type of question.
metadata
Additional information.
question_template
Template used to form the question.
answer_template
Template used to form the answer.
qtype
Tag for type of question.
mode
Category of plot.
num_subplots
Number of plots in the image.
num_funcs_on_subplot
Number of functions on the subplot associated with the question.
num_funcs_on_fig
Total number of functions on the image.
PlotTwist-train Finetuning data is contained in the zipped files: 'PlotTwist-train.z01' (9.1G) and 'PlotTwist-train.zip' (6G).
Dataset license
Dataset citation
Qualcomm AI Research
AI is shifting from simply seeing what is happening in front of the camera to understanding it. Data is the effective force behind these deep learning breakthroughs and is integral to the human-level performance of neural networks. Our crowd-acting approach to data collection overcomes the typical limitations of crowdsourcing, resulting in high-quality video data that is densely captioned, human-centric, and diverse.
Qualcomm AI Research continues to invest in and support deep-learning research in computer vision. The publication of the Jester dataset for use by the AI research community is one of our many initiatives.
Find out more about Qualcomm AI Research.
For any questions or technical support, please contact us at research.datasets@qti.qualcomm.com
Qualcomm AI Research is an initiative of Qualcomm Technologies, Inc.
Connect with our communities


Stay ahead of the curve
Receive the latest updates, exclusive offers, and valuable insights delivered through the Qualcomm newsletter straight to your inbox.
Stay ahead of the curve
Receive the latest updates, exclusive offers, and valuable insights delivered through the Qualcomm newsletter straight to your inbox.

